JBRA Assist. Reprod. 2025;29(Suppl 1):1-1
ORAL PRESENTATION
doi: 10.5935/1518-0557.20250059
O-01. Real-life clinical practice: Effectiveness of the Ovarian Response Prediction Index (ORPI) as a tool for predicting ovarian response in ART cycles
1Center for Human Reproduction Prof Franco Jr, Ribeirao Preto, Brazil
2Paulista Center for Diagnosis Research and Training, Ribeirao Preto, Brazil
Objective: Knowledge about a patient’s potential ovarian response can help assisted reproductive clinicians adjust medication dosages to reduce the adverse effects of low/excessive ovarian response. Despite the predictive power of individual markers, these markers all have associated estimation errors. Therefore, predicting ovarian response with a single biomarker may not be sufficient to develop an accurate treatment plan. Some studies have highlighted the ORPI as a more comprehensive tool for predicting ovarian response, but others have questioned its validity. Thus, further evaluation of the ORPI is still needed. This study aimed to analyse if the ORPI, based on anti-Mullerian hormone (AMH) levels, antral follicle count (AFC) and age, reliably can predict ovarian stimulation response and clinical pregnancy in real-life clinical practice.
Methods: This cohort study included 1,310 patients enrolled in the ART program in the last four years. No inclusion restrictions were applied. ORPI values were calculated by multiplying the AMH level(ng/ml) by the AFC (2-9 mm). The result was divided by the patient’s age (years) [ORPI= (AMH x AFC)/Age]. AMH/AFC were evaluated in a previous cycle. The decision about the stimulation protocol was made at the discretion of the clinician, and the starting dose of FSH was based on the ORPI. The endpoints were clinical pregnancy, FSH dose, number of follicles, oocytes retrieved (total/MII) and embryos. Spearman’s test, logistic regression and ROC curves were used. The likelihood of the collection of ≥4oocytes (assessing poor ovarian response), ≥4MII oocytes, ≥15oocytes (assessing excessive response) and clinical pregnancy was analysed. ROC curves were constructed to examine the performance of the ORPI in predicting clinical pregnancy and the retrieval of ≥4oocytes, ≥4MII oocytes and ≥15oocytes. An optimised threshold was determined.
Results: The mean values for the ORPI, age, AMH concentration and AFC were 1.13±2.38, 36.8±4.3y, 2.12±2.45ng/mL, and 12.43±7.9, respectively. The regression analysis revealed significant positive correlations between the ORPI and the number of follicles (≥10mm and ≥18 mm), the number of oocytes collected (total and MII) and the number of embryos. Additionally, the regression analysis demonstrated significant negative correlations between the ORPI and total FSH dose. Logistic regression revealed that the ORPI values were significantly associated with the likelihood of clinical pregnancy (OR:1.09; p<0.001) and the collection of ≥4oocytes (OR:1.93; p <0.001), ≥4MII oocytes (OR:1.72; p<0.001) and ≥15oocytes (OR:1.29; p<0.001). The ROC curve showed an area under the curve (AUC): 0.84 / threshold:0.25, AUC: 0.81 / threshold:0.3, AUC:0.83 / threshold:1.09, and AUC:0.65 / threshold:0.38 regarding the probability of collecting ≥4oocytes, ≥4MII oocytes, ≥15oocytes and the probability of clinical pregnancy according to the ORPI value. Table 1 shows the results.
Conclusion: Even in uncontrolled situations (real-life clinical practice), the ORPI can accurately predict both the ovarian response and clinical pregnancy. The combination of different variables in the ORPI resulted in a precise index for predicting both ovarian response and clinical pregnancy. The ORPI could be used to improve the cost‒benefit ratio of ovarian stimulation regimens by guiding the selection of medications and tailoring the doses and regimens to actual patient needs.
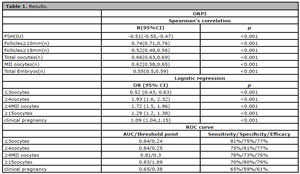
Table 1. Results.