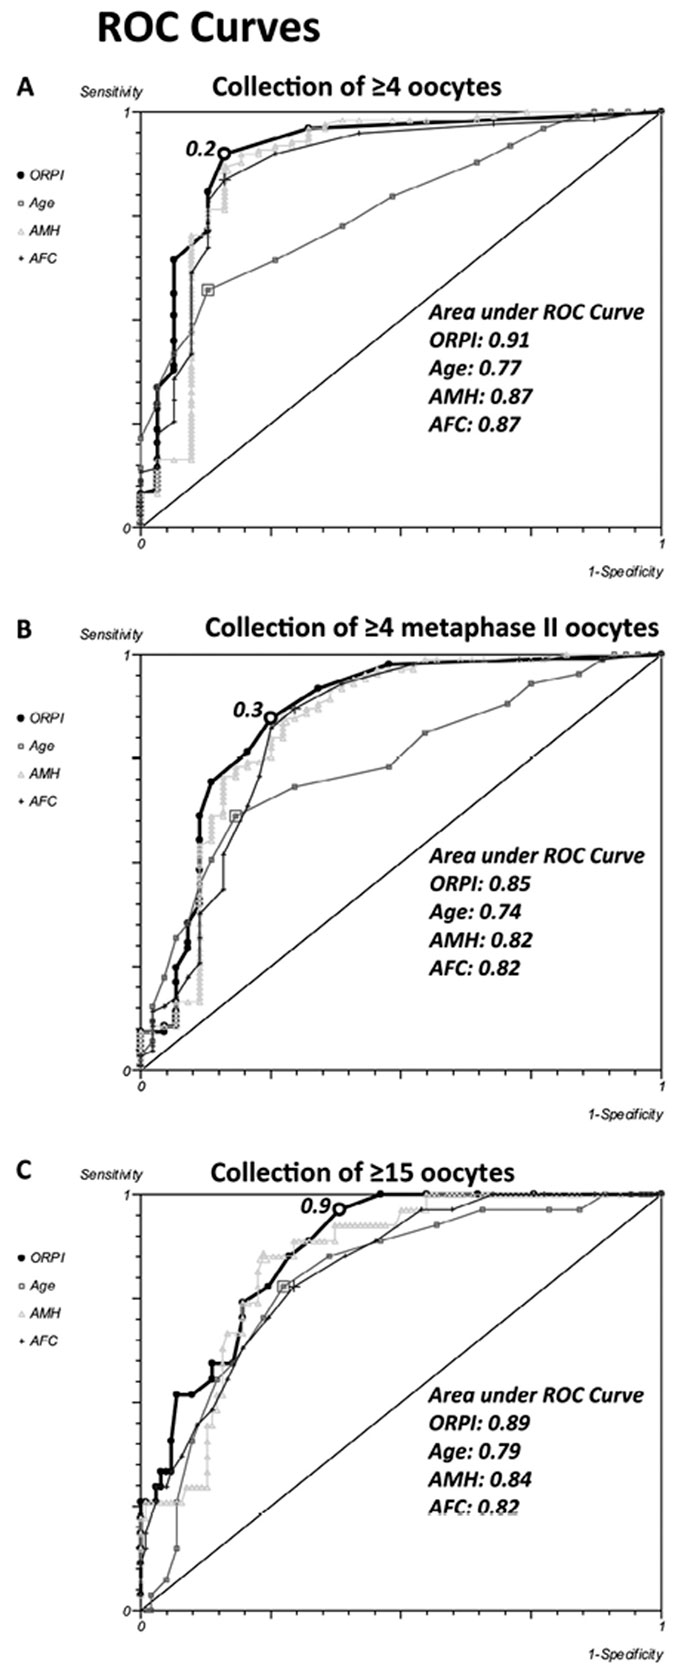
Figure 2. ROC Curve. The ROC curve analysis for ORPI as a prognostic factor regarding the collected oocytes. A. Collection of ≥4 oocytes. B. Collection of ≥4 metaphase II (MII) oocytes. C. Collection of ≥15 oocytes.
Figure 2. ROC Curve. The ROC curve analysis for ORPI as a prognostic factor regarding the collected oocytes. A. Collection of ≥4 oocytes. B. Collection of ≥4 metaphase II (MII) oocytes. C. Collection of ≥15 oocytes.