JBRA Assist. Reprod. 2025;29(Suppl 1):23-24
POSTER PRESENTATION
doi: 10.5935/1518-0557.20250078
P-010. Key performance indicators score (KPI score) based on clinical and laboratorial parameters for prediction of live birth in IVF fresh blastocyst transfer program
1Center for Human Reproduction Prof. Franco Jr, Ribeirao Preto, Brazil
2Paulista Center for Diagnosis- Research and Training, Riberao Preto, Brazil
Objective: To evaluate if KPIs score based on clinical and laboratorial parameters can establish benchmark for live birth in IVF fresh blastocyst transfer program.
Methods: It is a prospective cohort study, which a total of 106 IVF/ICSI cycles from 100 patients mean age 36.6±4.2, during 2023 to 2025. KPIs score was obtained by analysis of age, AMH (ng/ml), number of metaphase-II oocyte, fertilization rates and blastocyst morphological quality of embryonic lot. Blastocyst morphology was described as grade A, B or C, according to the of grade expansion (A=Full expanded Blastocyst, B=Completed blastocyst, C=Blastocyst), Gardner and Schoolcraft classification. The total KPIs score (Clinical/C-KPIs + Laboratorial/L-KPIs) was correlated with the presence or absence of live birth. The relationship between the C-KPIs score and L-KPIs score was analysed to establish quality standards to increase the performance of the clinical and laboratory work in ART. The maximum total KPIs score was 25 points (Table 1).
Results: The model of logistic regression (MLR) with respect to life birth and total KPIs score (106 cycles/43 live birth) resulted an odds ratio of 1.31, (95%CI=1.13-1.51 p=0.0002). Also, there was a significant difference (p<0.0001) with respect to the total KPIs score mean among the group of patients with live birth (KPIs score=20.4±2.8) and the group without live birth (KPIs score=17.6±3.6). Live birth probabilities (LBP) can be obtained using the MLR (prediction key) with the total KPIs score as a predictor variable; therefore, KPIs score 25/LBP=77%, KPIs score 20/LBP=47%, KPIs score 15/LBP= 18%, KPIs score 10/LBP=5% and KPIs score 5/LBP=1%. Table 2 describes all the LBP. On the other hand, the mean C-KPIs score and L-KPIs score obtained in the live birth group were 12.2±2.3 and 8.2±1.5, respectively. Routinely, in all cases where the C-KPIs score was ≥10 after the procedure but the L-KPIs score obtained was ≤6 (approximately two standard deviation less than the mean), a revision of the laboratory procedure was performed to check quality standards.
Conclusion: KPIs score was able to establish benchmarks for live birth. The data from this study showed that the values of the total KPIs score have an excellent correlation with the life birth, thus becoming an excellent predictor of the cycle analysed. In this way, it is possible to establish an individualized prognosis for each patient, avoiding a prediction based on global gestational data obtained in the clinic. This date is in accordance with our previous studies, in which our group has demonstrated that KPIs-score could set up benchmarks for clinical pregnancy for fresh Day2/3 embryo transfers.

Table 1. KPIs score system.
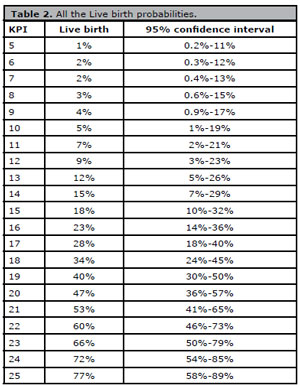
Table 2. All the Live birth probabilities.