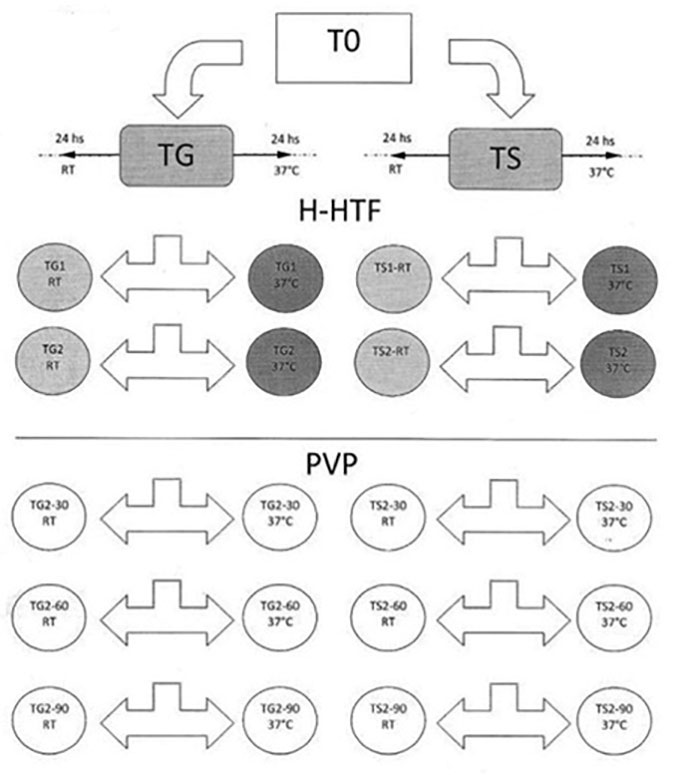
Figure 1. Flux diagram of the experimental design. T0= neat sample, TG= post gradient fraction, TS=post swim-up fraction, TG1 and TS1= 1hour post TG and TS, TG2 and TS2 = 2 hours post TG and TS, TG2-30/TS2-30, TG2-60/TS2-60, TG2-90/TS2-90 = 30, 60 and 90 post TG2/TS2, respectively. TG24-RT, TG24-37°C, TS24-RT and TS24-37°C corresponds to TG and TS after 24 hours of incubation at RT or 37°C.