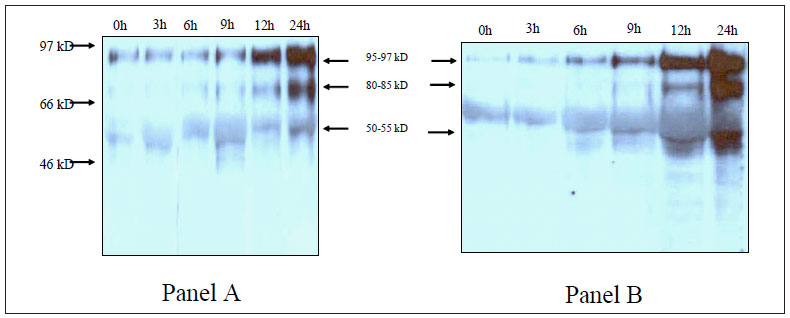
Figure 3. Experiment IIa: Time course of protein tyrosine phosphorylation of human spermatozoa incubated under capacitating conditions with two different HSA doses. Panel (A): HTF and 0.3% HSA; panel (B) HTF and 3% HSA. Numbers on the left of the figure represent markers of molecular weight (results of a representative fertile donor)..