JBRA Assist. Reprod. 2026;00(0):00-00
ORIGINAL ARTICLE
doi: 10.5935/1518-0557.20260088
Pilot Study Investigating the Genomic Landscape of Gonadotropin Response in Indonesian Women with Polycystic Ovary Syndrome
1IRSI Research and Training Centre, Jakarta, Indonesia
2STIKes PMC, Pekanbaru, Indonesia
3Faculty of Medicine and Nutrition, IPB University, Bogor, West Java, Indonesia
4Asa Ren, Jakarta, Indonesia
5Diagnos Laboratory, Jakarta, Indonesia
6Morula IVF Jakarta, Jakarta, Indonesia
7Department of Obstetrics and Gynecology, Faculty of Medicine, Universitas Kristen Indonesia, Jakarta, Indonesia
8Department of Obstetrics and Gynecology, School of Medicine and Health Sciences, Atmajaya Catholic University of Indonesia, Jakarta, Indonesia
CONFLICT OF INTEREST
None.
ABSTRACT
Objective: Genetic factors may influence variability in ovarian response to gonadotropin stimulation. However, evidence in women with polycystic ovary syndrome (PCOS), particularly in Southeast Asian populations, remains limited. This pilot study aimed to identify genetic variants associated with ovarian response to gonadotropin stimulation in Indonesian women with PCOS undergoing in vitro fertilization (IVF).
Methods: A subset of a genome-wide association study (GWAS) dataset comprising 172 women with PCOS was evaluated. All participants met at least two of the three Rotterdam criteria. Women from whom fewer than eight mature oocytes were retrieved after stimulation were categorized as hypo-responders (n=50), whereas those from whom eight or more mature oocytes were retrieved were categorized as normo-/hyper-responders (n=122). Associations between single-nucleotide polymorphisms (SNPs) and ovarian response were analyzed using additive logistic regression with Bonferroni correction for multiple testing.
Results: Clinical characteristics differed between hypo-responders and normo-/hyper-responders, including basal FSH (6.72 vs. 5.80mIU/mL, respectively; p=0.001), basal LH (4.80 vs. 6.24mIU/mL; p=0.040), AMH (3.15 vs. 5.23ng/mL; p<0.001), and basal AFC (14 vs. 19; p<0.001). The pilot GWAS identified six SNPs suggestively associated with ovarian hypo-response, with large effect sizes and higher minor allele frequencies among hypo-responders. Key loci included LAG3, NECTIN2, TOMM40, LRP1B, LDLRAD4, and C18orf15. Most variants were intronic and were enriched in women with reduced ovarian responsiveness.
Conclusion: This pilot GWAS identified potential genetic variants associated with gonadotropin hypo-response in Indonesian women with PCOS. Although no genome-wide significant associations were detected, the findings highlight candidate loci and pathways that warrant further investigation in larger, independent cohorts.
Keywords: genetic variants, PCOS, gonadotropin stimulation, ovarian response, IVF
INTRODUCTION
Polycystic ovary syndrome (PCOS) is recognized as the most common endocrine disorder among women of reproductive age worldwide, with an estimated global prevalence of 8%–18% (Norman et al., 2007). In Indonesia, it has been estimated to affect 4%–6.5% of reproductive-aged women (Sumapraja & Pangastuti, 2011). Despite its heterogeneous clinical presentation, PCOS is generally defined by the presence of menstrual irregularities or ovulatory dysfunction, hyperandrogenism, and the presence of polycystic ovarian morphology (PCOM) on ultrasound (Shi et al., 2012). The Rotterdam criteria remain the most widely applied criteria to diagnose PCOS, accounting for approximately 90.3% to 95.2% of PCOS diagnoses.
Several studies have shown interethnic differences in phenotype distribution. For example, the complete phenotype tends to be more prevalent among Caucasian women, while the non-hyperandrogenic phenotype appears to be more common in Indonesian and other Asian populations (Kim & Choi, 2019; Mumusoglu & Yildiz, 2020). Research conducted in Indonesia reported that around 63% of women with PCOS displayed normal androgen levels, yet still presented with other defining features of the condition (Wiweko et al., 2014). Such variation suggests a potential underlying genetic contribution to the syndrome’s pathophysiology. Investigating these genetic and molecular mechanisms may offer deeper insights into the development of PCOS among Indonesian women and could inform more personalized approaches to diagnosis and management.
As PCOS is the leading cause of infertility due to ovulatory dysfunction, assisted reproductive technologies such as IVF are commonly used by women seeking pregnancy. Optimal ovarian stimulation is a key component of a successful IVF cycle; this is typically measured by evaluating the number of retrieved oocytes or the number of mature oocytes following the ovum pick-up procedure. Given the nature of PCOS, women with this condition often exhibit increased response to gonadotropin stimulation, termed hyper-responders, due to increased antral follicle count and heightened sensitivity to FSH (Khan et al., 2019). In clinical practice of IVF programs, however, the response to gonadotropin stimulation may vary substantially among women and may be difficult to predict. Some women with the syndrome may respond poorly to gonadotropin stimulation, often called hypo-responders (Alviggi et al., 2018). As a result, during IVF for patients with PCOS, it is important to consider these factors when optimizing the procedure to ensure sufficient follicular development, while simultaneously minimizing complications.
Emerging evidence has suggested that genetic variants may contribute to the differing ovarian responses to gonadotropin stimulation. Recent studies have shown that polymorphisms in genes related to gonadotropin signaling, steroidogenesis, and folliculogenesis may affect sensitivity to gonadotropins such as FSH and LH and modulate ovarian response (Jun et al., 2006; Riccetti et al., 2017). Particularly, two studies conducted in 2023 found that variants in the follicle-stimulating hormone receptor (FSHR) gene may be associated with variability in response to controlled ovarian stimulation (Kaur et al., 2023; Alviggi et al., 2023). However, research regarding the potential correlation between genetic factors and ovarian response to gonadotropin stimulation in women with PCOS, as well as their clinical relevance, remains limited. To date, no study has characterized the genomic determinants of gonadotropin response specifically in Indonesian women with PCOS. Understanding this is critical for advancing personalized ovarian stimulation protocols in this population. Therefore, this pilot study aimed to identify genetic variants influencing ovarian response to gonadotropin stimulation during IVF among Indonesian women with PCOS, to elucidate genetic predispositions that influence variability in ovarian stimulation treatment outcomes.
MATERIALS AND METHODS
Study Population and Ethics Approval
This was a multicenter observational study that analyzed 172 women with PCOS according to their response to gonadotropin stimulation. PCOS diagnosis followed the Rotterdam 2003 criteria, requiring at least two of the following features: oligo-ovulation or anovulation (fewer than eight menstrual cycles per year), polycystic ovarian morphology confirmed by ultrasound (≥12 follicles measuring 2–9 mm in at least one ovary), or clinical and/or biochemical hyperandrogenism. All PCOS participants exhibited infertility-related symptoms and were categorized as hypo-responders, from whom fewer than eight mature oocytes were retrieved, and normo-/hyper-responders from whom eight or more mature oocytes were retrieved (Suheimi et al., 2025). Women were excluded if they were older than 40 years, had hyperandrogenism due to other endocrine conditions (such as hyper-prolactinaemia, congenital adrenal hyperplasia, or androgen-secreting tumors), had taken medications affecting hormonal or metabolic profiles (including metformin, hormonal contraceptives, or systemic glucocorticoids) within six months prior to sampling, or had a diagnosis of type 1 diabetes. Individuals undergoing mild ovarian stimulation protocols, those who failed to produce mature oocytes, and those who withdrew consent were also excluded. Ethical approval was obtained from the Ethics Committee of the Faculty of Medicine, Universitas Indonesia – Cipto Mangunkusumo Hospital (KET-371/UN2.F1/ETIK/PPM.00.02/2024), and all procedures were conducted in accordance with the Declaration of Helsinki (2008). Written informed consent was obtained from all participants.
Sample Collection and Demographic, Hormonal, and Clinical Measurements
Venous blood samples were obtained from each participant, with blood collected into one 5-mL EDTA tube and one 5-mL clot-activator tube and processed either immediately or within 48 hours, with the latter stored at -20°C until analysis. The clot-activator tube was centrifuged for serum separation and subsequently used for measurement of testosterone and sex hormone–binding globulin, while the EDTA tube was reserved for DNA extraction and genotyping. Demographic and clinical data were collected at Morula IVF Clinics in Jakarta, Surabaya, and Yogyakarta according to standardized procedures. At enrollment, participants reported demographic characteristics (including age and ethnicity), lifestyle behaviors (such as smoking history and alcohol consumption), and relevant medical and infertility histories. Anthropometric measurements, which included height, weight, and waist circumference, were recorded, and body mass index was calculated as weight in kilograms divided by height in meters squared. Information regarding menstrual cycle characteristics, such as typical cycle length and regularity, was self-reported. Biochemical analyses of reproductive and metabolic hormones, including total testosterone, SHBG, and basal reproductive hormones, were performed as previously described (Suheimi et al., 2025).
DNA Extraction and Genotyping
Genomic DNA was extracted from peripheral blood using the QIAamp DNA Blood Mini Kit (QIAGEN) following the manufacturer’s spin-column protocol. DNA purity and concentration were assessed using the NanoDrop One UV-Vis spectrophotometer, Qubit dsDNA High-Sensitivity Assay, and agarose gel electrophoresis. Samples with an OD260/280 ratio of approximately 1.8 and DNA concentrations exceeding 50ng/μL were advanced to genotyping. Genome-wide genotyping was performed using the Illumina Infinium Global Screening Array v3.0 on the iScan platform, interrogating ~650,000 SNPs. All genotyping procedures were in accordance with the Illumina protocol.
Data Processing and Quality Control
Raw fluorescence intensity files (IDAT) were processed and converted to VCF format for downstream analysis on an AWS c5.2xlarge instance (8-core CPU, 16 GB RAM). All samples (n=172) were genotyped and processed through the bioinformatics pipeline of GWAS with no samples excluded. All genome-wide association analyses were conducted using PLINK v1.9. Standard quality control procedures were applied at both the sample and SNP levels, including thresholds for call rate (<98%), minor allele frequency (<5%), and deviation from Hardy–Weinberg equilibrium in normo-/hyper-ovarian response, as it is considered a normal condition for women with PCOS (p<1 × 10⁻⁶). This filtering process resulted in 289,137 SNPs. Prior to principal component analysis and identity-by-descent estimation, SNPs were pruned for linkage disequilibrium with a sliding window of 50 SNPs, a step size of 5, and an r2 threshold of 0.2 (--indep-pairwise 50 5 0.2), retaining only approximately independent markers for downstream analyses. After SNP pruning, 91,768 SNPs were retained and used for the association study. Heterozygosity outliers were identified and excluded based on ±3 standard deviations from the mean. Principal component analysis (PCA) based on pruned SNPs was also carried out to ensure population structure based on ancestry in this study. To observe genomic inflation in our population, the QQ plot and genomic inflation factor were also evaluated. Cryptic relatedness was assessed using pairwise identity by descent (IBD) estimation. Sample pairs with PI_HAT>0.125 were identified as related samples. Variants passing quality control were used to compute allele frequencies, odds ratios, and association p values.
Statistical Analysis
Statistical analyses were performed using SPSS version 26. Baseline clinical and demographic variables between the two groups were summarized using descriptive statistics, with continuous variables presented as mean±SD or median (Q1, Q3), depending on distribution. Normality was assessed using the Kolmogorov–Smirnov test. Group comparisons were conducted using unpaired Student’s t-tests for normally distributed variables or the Mann–Whitney U test for non-normal distributions. Genetic associations were evaluated using an additive logistic regression model with adjustment for principal components to examine the effects of minor-allele dosage across homozygous major, heterozygous, and homozygous minor genotypes. To account for multiple testing, the Bonferroni correction was applied, resulting in a significance threshold of 3×10⁻⁶. Effect sizes were reported as odds ratios (ORs) with 95% confidence intervals (CIs).
RESULTS
Clinical and Baseline Characteristics
A total of 172 women with PCOS undergoing IVF were included in the analysis, comprising 50 hypo-responders and 122 normo-/hyper-responders. Baseline demographic variables, including age, weight, BMI, waist circumference, infertility duration, type of infertility, surgical history, medical history, allergy status, and lifestyle factors, showed no significant differences between the two groups (p>0.05) (Table 1). Menstrual cycle regularity and blood pressure classification were also comparable between groups. Several endocrine and ovarian reserve markers differed significantly between normo-/hyper-responders and hypo-responders. Hypo-responders demonstrated higher basal FSH levels (6.72 vs. 5.80mIU/mL, p=0.001) and lower basal LH (4.80 vs. 6.24mIU/mL, p=0.040). Markers of ovarian reserve were significantly lower in the hypo-response group, including AMH (3.15 vs. 5.23ng/mL, p<0.001) and AFC (14 vs. 19, p<0.001). On the trigger day, hypo-responders had significantly lower estradiol (2504 vs. 5202pg/mL, p<0.001) and progesterone levels (0.59 vs. 0.96ng/mL, p=0.008). Regarding IVF outcomes, hypo-responders produced fewer total oocytes (9 vs. 17, p<0.001) and mature oocytes (6 vs. 13, p<0.001). No significant differences were observed in starting gonadotropin dose, total gonadotropin dose, stimulation duration, endometrial thickness, testosterone levels, SHBG, FAI, or random glucose (p>0.05).
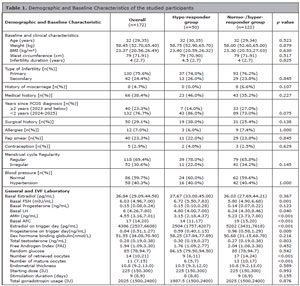
Table 1. Demographic and Baseline Characteristics of the studied participants
Note: nonnormally distributed data are presented as median (q1,q3), and the Mann-Whitney U test is used. Data are presented as the number of subjects and percentage [n (%)], and chi-square tests are used for the categorical variable. p<0.05 was considered statistically significant. BMI: body mass index; PCOS: polycystic ovary syndrome; FSH: follicle-stimulating hormone; LH: luteinizing hormone; AMH: anti-Mullerian hormone; IU: international unit.
Genome-Wide Association Analysis
Principal component analysis (PCA) revealed that the studied population was relatively homogeneous, with no distinct population clusters observed except for three outlier samples (Figure 1). This suggests minimal population stratification and limited confounding due to ancestry. To account for residual population structure, the first four principal components (PC1-PC4) were applied as covariates in our association additive model. The number of components was determined based on the scree plot, which showed an inflection point at PC4 (Figure 2).
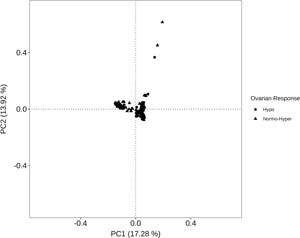
Figure 1. The principal component analysis plot based on pruned SNPs
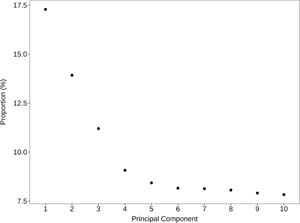
Figure 2. The scree plot demonstrates the variance explained by principal components with an inflection point observed at PC4
To assess the possibility of genomic inflation in the population, a QQ plot along with the calculation of the genomic inflation factor (λ) is shown in Figure 3. The QQ plot showed that the observed p values followed the expected distribution under the null hypothesis. The genomic inflation factor was 1.049, indicating minimal inflation. Furthermore, deviation from the expected distribution was observed only in the upper tail of the QQ plot, suggesting the potential association signals between SNPs and the phenotype. However, the observed p value (1E-05) did not reach the genome-wide significance threshold (3E-06); as such, SNPs were considered suggestive. The maximum observed PI_HAT value in the present dataset was 0.049, which is well below the commonly used threshold of 0.125. This finding indicated that no related samples were present in the dataset. Full association statistics, including chromosomal positions, allele frequencies, odds ratios, and confidence intervals, are provided in Table 2, while the Manhattan plot also shows the distribution of SNPs (Figure 4).
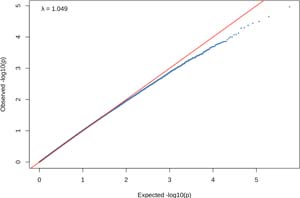
Figure 3. The Quantile-Quantile (QQ) plot of observed versus expected -log10 (p value) for SNP associations
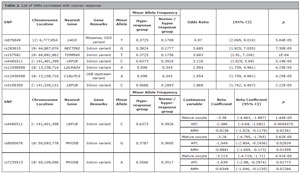
Table 2. List of SNPs correlated with ovarian responseSNPChromosome LocationNearest GeneGene RemarksMinor AlleleMinor Allele FrequencyOdds Ratio(95% CI)pHypo-response groupNormo-/hyper response grouprs87084912: 6,777,854LAG3Missense, CDS variantT0.37250.17084.07(2.065, 8.024)5.04E-05rs28381519: 44,887,076NECTIN2Intron variantG0.38240.17773.685(1.925, 7.055)7.30E-05rsl5758219: 44,892,962TOMM40Intron variantT0.37250.17363.683(1.91, 7.104)IE-04rs44855112: 141,401,398LRP1BIntron variantc0.63730.39263.226(1.829, 5.69)5.19E-05rsl245859818: 13,238,716LDLRAD4Intron variantA0.5980.3432.954(1.759, 4.961)4.25E-05rsl245859818: 13,238,716C18orfl52KB Upstream VariantA0.5980.3432.954(1.759, 4.961)4.25E-05rs31093502: 141,339,231LRP1BIntron variantC0.56860.28932.868(1.762, 4.467)2.22E-05SNPChromosome LocationNearest GeneGene RemarksMinor AlleleMinor Allele FrequencyContinuous variableBeta CoefficientBeta Coefficient (95% CI)pHypo-response groupNormo-/ hyper response grouprs44855112: 141,401,398LRP1BIntron variantC0.63730.3926Mature oocyte-3.38(-4.863, -1.897)1.44E-05AFC-2.386(-3.69, -1.082)0.0004375AMH-0.8236(-1.529, -0.1179)0.02341rs808587618: 50,093,778MY05BIntron variantG0.37870.3605Mature oocyte-3.28(-4.795, -1.765)3.62E-05AFC-1.549(-2.904, -0.1936)0.02639AMH-0.8891(-1.605, -0.173)0.01599rs723551318: 50,109,096MY05BIntron variantA0.35660.3517Mature oocyte-3.215(-4.719, -1.71)4.51E-05AFC-1.639(-2.98, -0.2974)0.01773AMH-0.8349(-1.546, -0.1235)0.02266Note: threshold p value: 3E-06; CDS: Coding DNA Sequence, KB: kilobases; CI: confidence interval
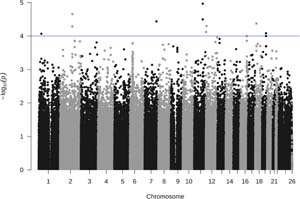
Figure 4. Manhattan plot of genome-wide SNP associations with hypo-response. The dashed line indicates the suggestive significance threshold (1E-4)
Genome-wide association testing evaluated SNPs for association with ovarian hypo-response using a Bonferroni-corrected threshold of 3 × 10⁻⁶. As shown in Table 2, no genome-wide significant associations were identified in this study. Several SNPs demonstrated suggestive associations with hypo-responder. The largest effect estimate was observed for rs870849 with the nearest gene being LAG3 (OR = 4.07 95%CI 2.065-8.024, p = 5.04 × 10⁻⁵), followed by rs283815 with the nearest gene being NECTIN2 (OR 3.685 95% CI 1.925–7.055, p = 7.30 × 10⁻⁵) and rs157582 within TOMM40 (OR = 3.683 95% CI 1.910-7.104, p = 1.00 × 10⁻⁴). Suggestive variants were distributed across several chromosomes, with clustering observed in specific loci, including LRP1B (rs4485511 and rs3109350). The suggestive variants were predominantly intronic, with rs870849 in LAG3 representing a missense coding variant. Across all associated loci, minor allele frequencies (MAFs) were consistently higher in the hypo-response group than in the normo-/hyper-responder group, indicating an enrichment of these alleles among individuals with reduced ovarian responsiveness.An in-depth analysis of ovarian response was performed using linear regression, treating the number of mature oocytes as a continuous outcome. SNPs passing quality control were tested, and those with the lowest p values were prioritized. The variant rs4485511, located near LRP1B, showed a negative beta coefficient, indicating an association with a lower number of retrieved mature oocytes. Additionally, rs8085876 and rs7235513, both located on chromosome 18 near MYO5B, were identified and similarly exhibited negative effect estimates. Consistent analyses using AMH and AFC as outcomes demonstrated that rs4485511, rs8085876, and rs7235513 also showed negative coefficients, suggesting a consistent direction of effect across ovarian reserve and response-related traits. However, the corresponding p values for AMH and AFC were not statistically significant after applying the Bonferroni-corrected significance threshold, indicating limited power and the need for larger sample sizes to confirm these associations.
DISCUSSION
This pilot study provides the first genome-wide investigation of gonadotropin response among Indonesian women with PCOS, addressing a major gap in reproductive genomics in Southeast Asian populations. The present study identified six SNPs suggestively associated with hypo-response, highlighting potential biological pathways involved in ovarian stimulation outcomes. Several of these variants are intronic and may influence gene regulation. Our findings align with the 2022 Delphi consensus, which reflected growing agreement on the association between genetic polymorphism and ovarian response phenotype, as well as the need for further investigation into its role (Conforti et al., 2022). Many existing studies examining predictors of ovarian stimulation outcomes have focused on candidate genes, particularly FSHR, FSHB, LHB, and LHCGR (Suheimi et al., 2025; Alviggi et al., 2023; Conforti et al., 2022; La Marca et al., 2013). However, the broader genetic architecture underlying differential ovarian responsiveness still lacks clarity, particularly within Asian cohorts where ovarian biology and stimulation profiles differ significantly from those of European populations (Kim & Choi, 2019; Mumusoglu & Yildiz, 2020). A previous GWAS reported no SNPs significantly correlated with ovarian sensitivity to gonadotropin response (van Disseldorp et al., 2011), which supports the complexity of this phenotype and the exploratory nature of the present findings.
The lead variant rs870849 is a missense coding variant in LAG3, an immune checkpoint gene (Ruffo et al., 2019). Previous studies have reported this SNP in immune-related, neurologic, transplant, and hematologic conditions, although findings are inconsistent and context-dependent. However, to the best of our knowledge, its role in ovarian response has not been previously reported. TOMM40, a mitochondrial membrane translocase gene, is central to mitochondrial protein import and ATP production (Chen et al., 2022). Given that mitochondrial competence is essential for granulosa cell steroidogenesis and oocyte maturation, variation in TOMM40 may influence ovarian responsiveness through altered energy metabolism (Kirillova et al., 2021; Yang et al., 2020). Another suggestive associated variant, rs283815, located in NECTIN2, a gene involved in cell adhesion and tissue remodeling. Although direct evidence linking these genes to ovarian response is currently limited, the presence of variants in these regions may influence ovarian responsiveness via altered cellular interactions or extracellular microenvironment regulation. This interpretation is biologically plausible, as follicular growth depends on coordinated cell–cell communication, extracellular matrix turnover, and structural support within the follicular niche (Wang & Yang, 2025).
Another key finding was the presence of multiple suggestive variants clustered within LRP1B, suggesting a potentially relevant genomic locus. LRP1B encodes a tumor suppressor involved in endocytosis, extracellular matrix organization, and modulation of cell–cell interactions (Príncipe et al., 2021). Although not traditionally associated with ovarian physiology, the gene’s expression in reproductive tissues and its role in maintaining cellular integrity may indicate involvement in follicular microenvironment stability. The clustering of potential SNPs suggests a regulatory region influencing ovarian cellular function, potentially impacting granulosa cell responsiveness to exogenous gonadotropins. In addition, modeling ovarian response as a continuous trait provided complementary insight to the binary analysis, identifying variants with consistent negative effects on oocyte yield and related markers (AMH and AFC). Notably, the variant near LRP1B (rs4485511) showed a consistent negative direction of association across mature oocyte number, AMH, and AFC, supporting its potential relevance to ovarian response-related traits. Although these findings remain exploratory and underpowered, the consistent direction of effect highlights the need for validation in larger cohorts.
Together, these results suggest that ovarian stimulation outcomes in PCOS may be influenced not only by canonical reproductive hormone pathways but also by mitochondrial function, immune modulation, extracellular matrix dynamics, and oxidative stress regulation. Given that none of the exploratory loci have previously been linked to gonadotropin hypo-response, this study identifies potentially important biological pathways for further mechanistic investigation. However, these findings should be interpreted cautiously as preliminary. The study’s modest sample size increases the risk of false positives, and replication in larger, independent cohorts is essential before clinical application. Functional validation, such as expression studies in granulosa cells or ovarian tissue, will also be needed to clarify the mechanistic relevance of the associated variants. Nevertheless, this pilot GWAS provides an initial map of candidate genetic markers that may contribute to ovarian response heterogeneity among Indonesian women with PCOS and supports more extensive genomic studies in the region.
CONCLUSION
This pilot GWAS identified suggestive genetic variants associated with hypo-response to gonadotropin stimulation among Indonesian women with PCOS. The candidate loci highlight biological pathways related to mitochondrial function, immune regulation, extracellular matrix dynamics, oxidative balance, and intracellular signaling; all pathways not typically captured in traditional reproductive genetics studies. While the findings require replication in larger cohorts and functional validation, they provide a foundation for understanding the genomic determinants of ovarian stimulation outcomes in Southeast Asian populations and may support future development of personalized gonadotropin dosing strategies.
REFERENCES
Alviggi C, Conforti A, Esteves SC, Vallone R, Venturella R, Staiano S, Castaldo E, Andersen CY, de Placido G. Understanding Ovarian Hypo-Response to Exogenous Gonadotropin in Ovarian Stimulation and Its New Proposed Marker-The Follicle-To-Oocyte (FOI) Index. Front Endocrinol (Lausanne). 2018;9:589. PMID: 30386293 DOI: 10.3389/fendo.2018.00589
Medline
Alviggi C, Longobardi S, Papaleo E, Santi D, Alfano S, Vanni VS, Campitiello MR, De Rosa P, Strina I, Huhtaniemi I, Pursiheimo JP, D’Hooghe T, Humaidan P, Conforti A. Genetic Variants of Gonadotropins and Their Receptors Could Influence Controlled Ovarian Stimulation: IVF Data from a Prospective Multicenter Study. Genes (Basel). 2023;14:1269. PMID: 37372449 DOI: 10.3390/genes14061269
Medline
Chen S, Sarasua SM, Davis NJ, DeLuca JM, Boccuto L, Thielke SM, Yu CE. TOMM40 genetic variants associated with healthy aging and longevity: a systematic review. BMC Geriatr. 2022;22:667. PMID: 35964003 DOI: 10.1186/s12877-022-03337-4
Medline
Conforti A, Tüttelmann F, Alviggi C, Behre HM, Fischer R, Hu L, Polyzos NP, Chuderland D, Rama Raju GA, D’Hooghe T, Simoni M, Sunkara SK, Longobardi S. Effect of genetic variants of gonadotropins and their receptors on ovarian stimulation outcomes: a Delphi consensus. Front Endocrinol (Lausanne). 2022;12:797365. PMID: 35178027 DOI: 10.3389/fendo.2021.797365
Medline
Jun JK, Yoon JS, Ku SY, Choi YM, Hwang KR, Park SY, Lee GH, Lee WD, Kim SH, Kim JG, Moon SY. Follicle-stimulating hormone receptor gene polymorphism and ovarian responses to controlled ovarian hyperstimulation for IVF-ET. J Hum Genet. 2006;51:665-70. PMID: 16871362 DOI: 10.1007/s10038-006-0005-5
Medline
Kaur M, Singh S, Kaur A. Polymorphisms in FSHR modulating susceptibility to polycystic ovary syndrome: an updated meta-analysis. J Ovarian Res. 2023;16:183. PMID: 37653412 DOI: 10.1186/s13048-023-01238-7
Medline
Khan MJ, Ullah A, Basit S. Genetic basis of polycystic ovary syndrome (PCOS): current perspectives. Appl Clin Genet. 2019;12:249-60. PMID: 31920361 DOI: 10.2147/TACG.S200341
Medline
Kim JJ, Choi YM. Phenotype and genotype of polycystic ovary syndrome in Asia: Ethnic differences. J Obstet Gynaecol Res. 2019;45:2330-7. PMID: 31588677 DOI: 10.1111/jog.14132
Medline
Kirillova A, Smitz JEJ, Sukhikh GT, Mazunin I. The role of mitochondria in oocyte maturation. Cells. 2021;10:2484. PMID: 34572133 DOI: 10.3390/cells10092484
Medline
La Marca A, Sighinolfi G, Argento C, Grisendi V, Casarini L, Volpe A, Simoni M. Polymorphisms in gonadotropin and gonadotropin receptor genes as markers of ovarian reserve and response in in vitro fertilization. Fertil Steril. 2013;99:970-8.e1. PMID: 23380184 DOI: 10.1016/j.fertnstert.2013.01.086
Medline
Norman RJ, Dewailly D, Legro RS, Hickey TE. Polycystic ovary syndrome. Lancet. 2007;370:685-97. PMID: 17720020 DOI: 10.1016/S0140-6736(07)61345-2
Medline
Príncipe C, de Sousa IJD, Prazeres H, Soares P, Lima RT. LRP1B: a giant lost in cancer translation. Pharmaceuticals (Basel). 2021;14:836. PMID: 34577535 DOI: 10.3390/ph14090836
Medline
Riccetti L, De Pascali F, Gilioli L, Santi D, Brigante G, Simoni M, Casarini L. Genetics of gonadotropins and their receptors as markers of ovarian reserve and response in controlled ovarian stimulation. Best Pract Res Clin Obstet Gynaecol. 2017;44:15-25. PMID: 28506471 DOI: 10.1016/j.bpobgyn.2017.04.002
Medline
Ruffo E, Wu RC, Bruno TC, Workman CJ, Vignali DAA. Lymphocyte-activation gene 3 (LAG3): the next immune checkpoint receptor. Semin Immunol. 2019;42:101305. PMID: 31604537 DOI: 10.1016/j.smim.2019.101305
Medline
Shi Y, Zhao H, Shi Y, Cao Y, Yang D, Li Z, Zhang B, Liang X, Li T, Chen J, Shen J, Zhao J, You L, Gao X, Zhu D, Zhao X, Yan Y, Qin Y, Li W, Yan J, et al. Genome-wide association study identifies eight new risk loci for polycystic ovary syndrome. Nat Genet. 2012;44:1020-5. PMID: 22885925 DOI: 10.1038/ng.2384
Medline
Suheimi I, Wiweko B, Thuffi R, Muharam R, Asmarinah, Indriatmi W, Malik SG, Boediono A, Hidayat ST, Sini I, Sirait B. Luteinizing hormone β-subunit gene polymorphisms and androgen levels are less predictive of ovarian response in polycystic ovary syndrome in vitro fertilisation women: a nested case-control study. J Hum Reprod Sci. 2025;18:239-45. PMID: 41560878 DOI: 10.4103/jhrs.jhrs_7_25
Medline
van Disseldorp J, Franke L, Eijkemans R, Broekmans F, Macklon N, Wijmenga C, Fauser B. Genome-wide analysis shows no genomic predictors of ovarian response to stimulation by exogenous FSH for IVF. Reprod Biomed Online. 2011;22:382-8. PMID: 21316307 DOI: 10.1016/j.rbmo.2010.12.006
Medline
Wang H, Yang L. Ovarian Mechanobiology: Understanding the Interplay Between Mechanics and Follicular Development. Cells. 2025;14:355. PMID: 40072084 DOI: 10.3390/cells14050355
Medline
Wiweko B, Maidarti M, Priangga MD, Shafira N, Fernando D, Sumapraja K, Natadisastra M, Hestiantoro A. Anti-mullerian hormone as a diagnostic and prognostic tool for PCOS patients. J Assist Reprod Genet. 2014;31:1311-6. PMID: 25119192 DOI: 10.1007/s10815-014-0300-6
Medline
Yang W, Shin HY, Cho H, Chung JY, Lee EJ, Kim JH, Kang ES. TOM40 Inhibits Ovarian Cancer Cell Growth by Modulating Mitochondrial Function Including Intracellular ATP and ROS Levels. Cancers (Basel). 2020;12:1329. PMID: 32456076 DOI: 10.3390/cancers12051329
Medline